By Sebthomas - 5/26/2025 1:52:25 PM
My first post on this forum please move if there is a more suitable area for this suggestion for improvement.
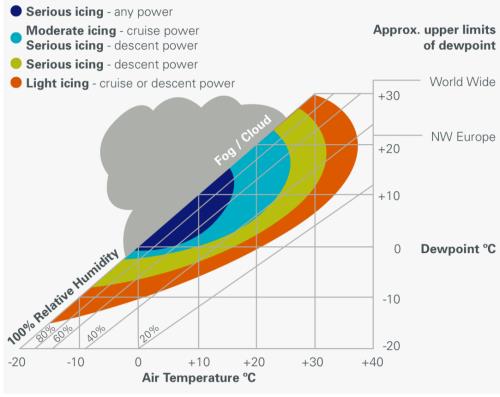
I recently experienced quite severe carb icing below cloud on a day where it was not immediately obvious that this was going to happen (no low cloud, dry grass, BKN cloud base 3k and moderate temps). In retrospect, review of temp and dew point at a nearby aerodrome (from memory 12° temp, 5° dewpoint) showed that these posed a “serious risk any power” on the CAA graph.
I really appreciate the way that SD shoes the actual humidity on every METAR based on the Temp and Dew point. I wonder if it could add a row below this humidity -showing one of the four risk categories or no risk of carb icing based on the temp and dewpoint applied to CAA graph (uploaded below)?
|
By ArnaudC - 6/30/2025 5:33:26 PM
SD cannot know the conditions at your current altitude, nor if there is a cloud above dumping additional moisture.
|
|