By pschartau - 5/23/2015 12:32:23 PM
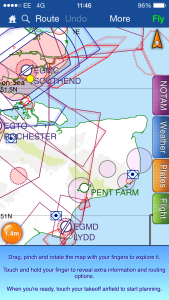
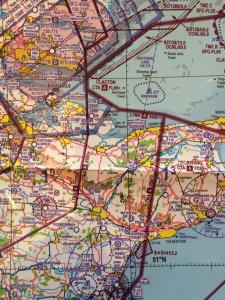
It looks like SkyDemon draws a box around airways, which causes some differences compared to the CAA charts once you get to the end of the airways.
Compare L10 here on SkyDemon vs. paper chart:
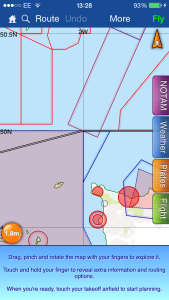
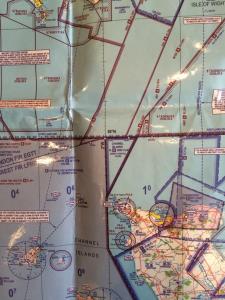
And Q41 near the Channel Islands:
Any thoughts?
Thanks
Phil
|
By Tim Dawson - 5/28/2015 4:15:58 PM
I've just had a check of this, and that fillet should not have been present in the SkyDemon chart. Unlike some others, which are correct, that one is our mistake. We will get this corrected for the next chart update. Many thanks for your help.
|
|